In part 1 of this series we saw what we can do in terms of performance monitoring without any customization in IMC. This means only by installing IMC and discovering devices Now let's see the customization part.
Here is where the cool stuff begins:
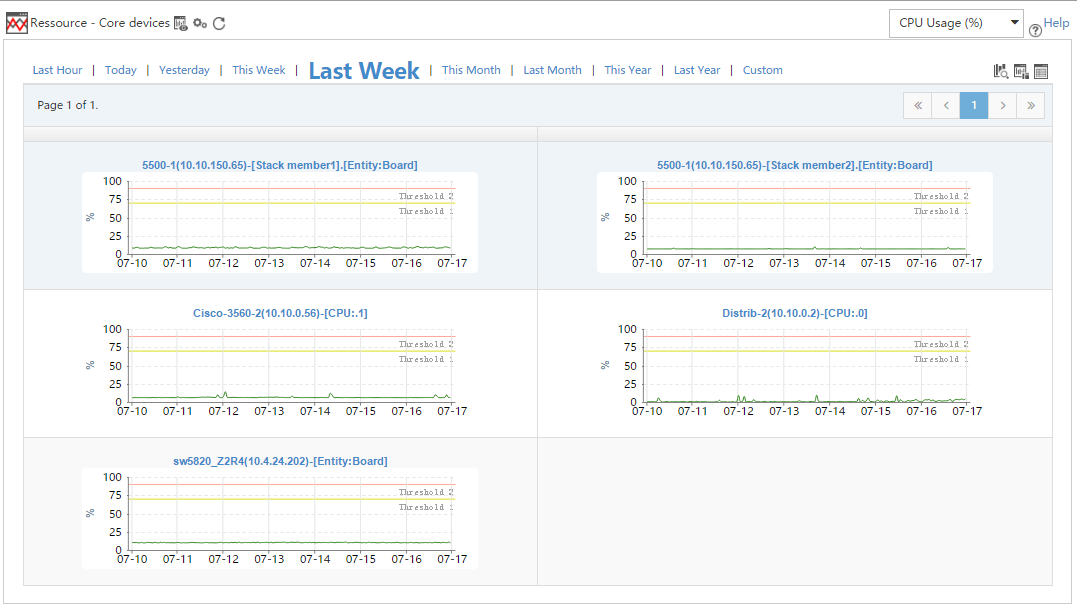
- We can add some performance views with the data we already have, in order to enable. For example, here are some Trend Lines of CPU and Memory usage for our core devices:
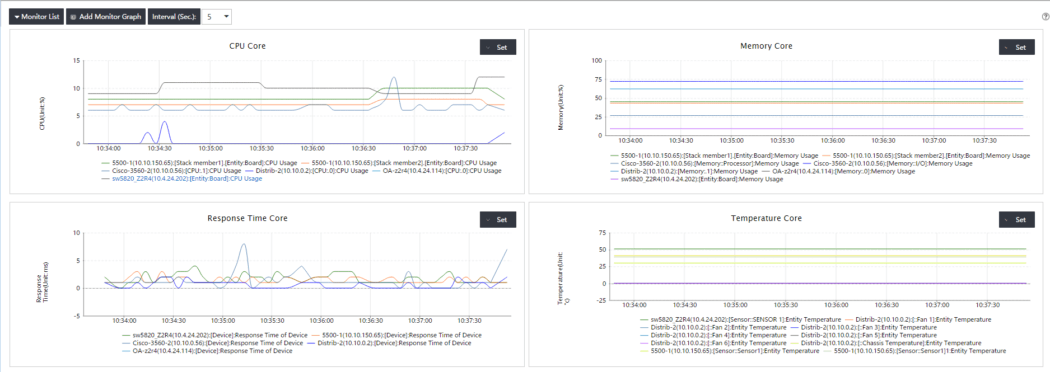
- We can also add some customised "Real-Time monitoring" pages (in Performance Management à Real-Time monitoring). Doing so we can have a very quick access to live information for live debugging.
- You may feel frustrated with only a few performance metrics to monitor Don't worry, there are about 445 predefined performance indexes you just need to activate in order to monitor these 🙂
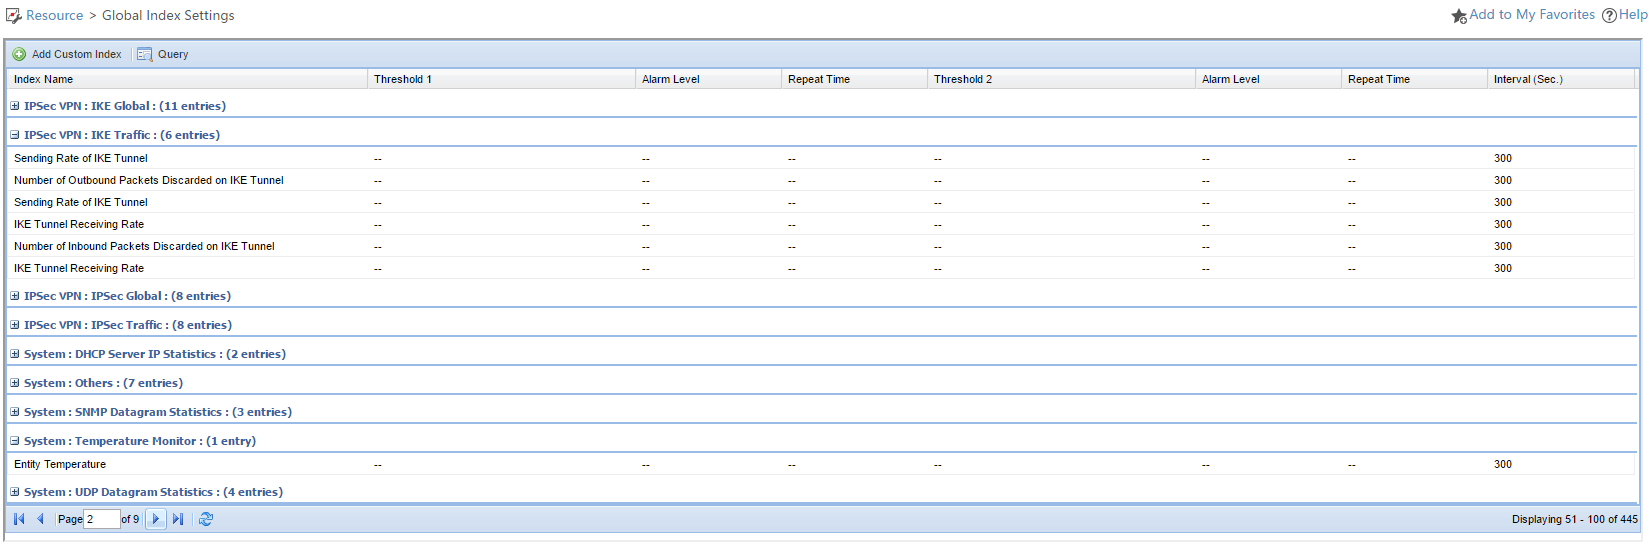
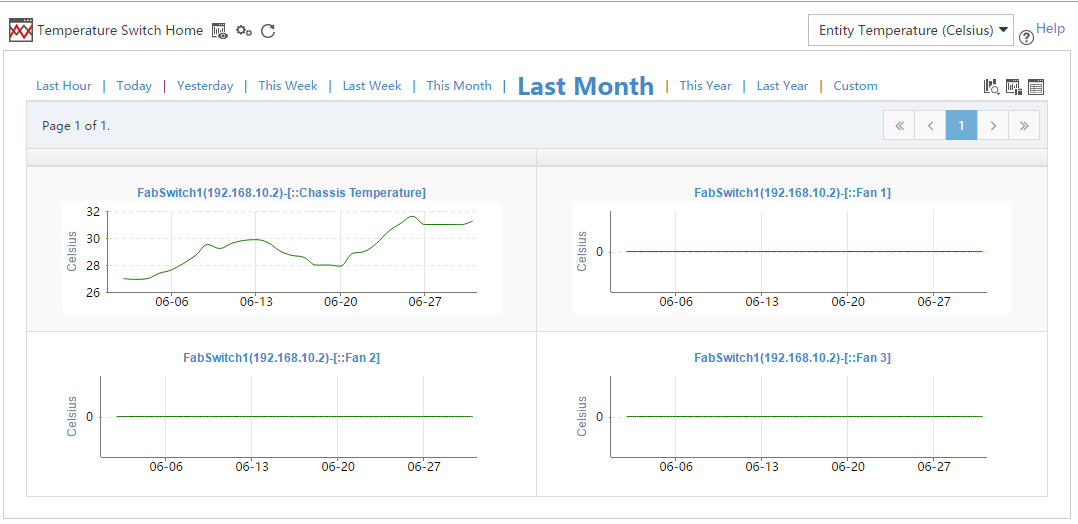
So we can, for example, monitor device temperature, interfaces bandwidth, error packets, QoS Below is an example of adding temperature monitoring:
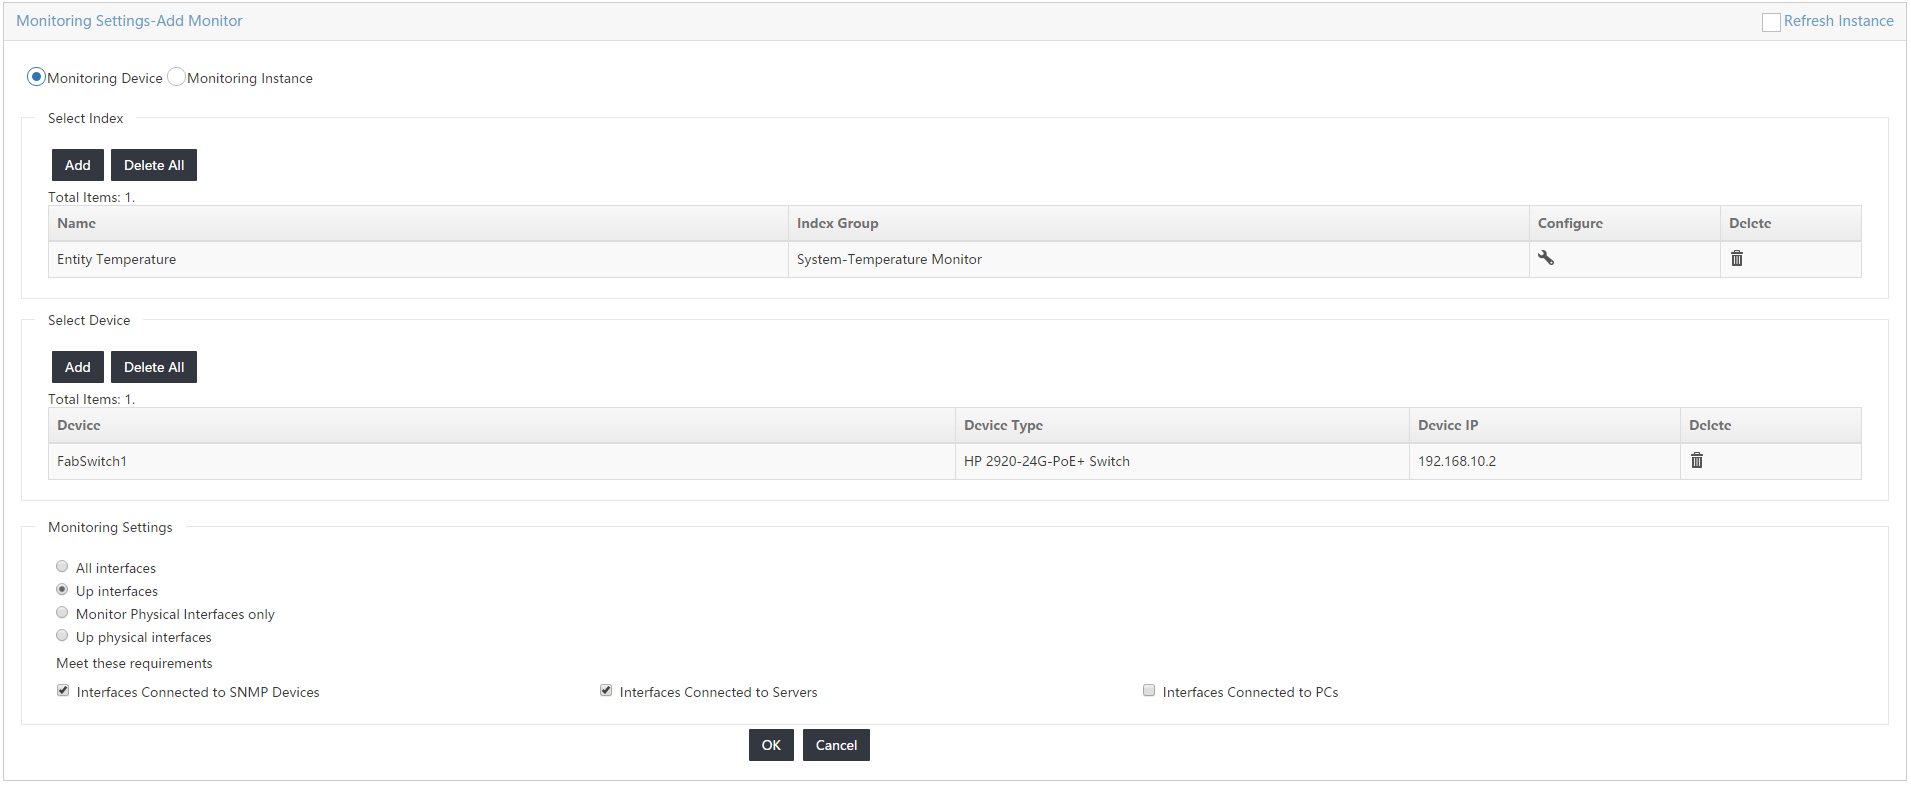
And the result:
- And if you need even more You can add your own global index (everything you want if this can be obtained through SNMP), either in an existing category or in a user-defined one. Only things you need to know are the SNMP system Object Identifier of the data you need and the formula to calculate the performance index. Below we add SFP transceiver Transmitted Power for ArubaOS devices to the predefined category "Transceiver Current Transmitted Power".
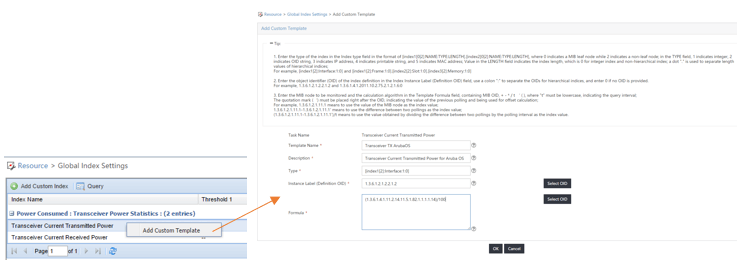
And so we can now add this metric as we usually do with predefined ones 🙂
- Let's finish with another interesting feature. We can add any of the monitoring indexes configured above to the topology. For example, we can say that for switches we want to display the temperature and that we want to display some interface statistics on the links:

And so when you select a device or a link you should see something like this:

There are many other things you can do, such as adding dashboards, playing with RMON, configuring schedule reports to be sent by email I'll let you discover by yourself. And also we can use IMC NTA (Network Traffic Analyser) module in order to analyse more precisely the traffic on our infrastructure. I promise I'll be back soon with another blog in this series.


