
Aruba EdgeConnect SD-WAN is a powerful solution that enables organizations to build resilient and efficient wide-area networks. Application visibility, real-time performance monitoring and security monitoring are critical aspects of managing an SD-WAN infrastructure effectively. This blog explores application visibility, performance monitoring, and security management best practices for achieving these objectives using Aruba EdgeConnect SD-WAN.
Application Visibility Best Practices
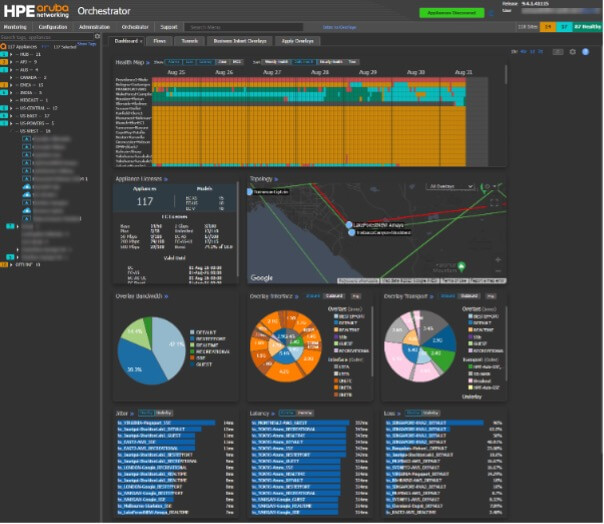
Customizable Orchestrator dashboard to check the state of the network. EdgeConnect provides a customizable top-level view of the network with a dashboard view of appliance health, application performance and other key performance indicators. The dashboard supports configurable widgets that can be arranged to meet network visualization requirements. For example, you can configure widgets to view top talkers, top domains, licenses and the health map showing which appliances have exceeded threshold levels. And you can also add a topology map showing any underlay or overlays which are down, enabling the operator to dive deeper into the network performance analysis. The dashboard can be fully customized to make it your own.
Using NetFlow and IPFIX for application visibility. NetFlow and IPFIX are essential technologies that provide visibility into network traffic. EdgeConnect appliances can be configured to export NetFlow and/or IPFIX data from EdgeConnect appliances into monitoring tools, providing network engineers with insights into application usage, traffic patterns and bandwidth utilization. This information is valuable for optimizing network resources and identifying potential performance bottlenecks.
Leveraging Orchestrator and ECOS REST API for application visibility. Aruba Orchestrator and EdgeConnect offer comprehensive REST APIs that allow network engineers to interact programmatically with the SD-WAN infrastructure. By using these APIs, organizations can access real-time information about applications, network health, and performance. This data enables network engineers to make data-driven decisions to enhance application visibility and performance monitoring. For more details on the Rest APIs for monitoring please visit the Aruba devHub.
Polling EdgeConnect loopback for application traffic. Using management services templates to pin management traffic to the EdgeConnect loopback provides better control over application traffic. By steering certain types of traffic through the loopback, it becomes easier to monitor and manage specific application flows effectively. Use the Loopback Orchestration tab to create a pool of loopback addresses from which Orchestrator can automatically create loopback interfaces.
Real-time Performance Monitoring Best Practices
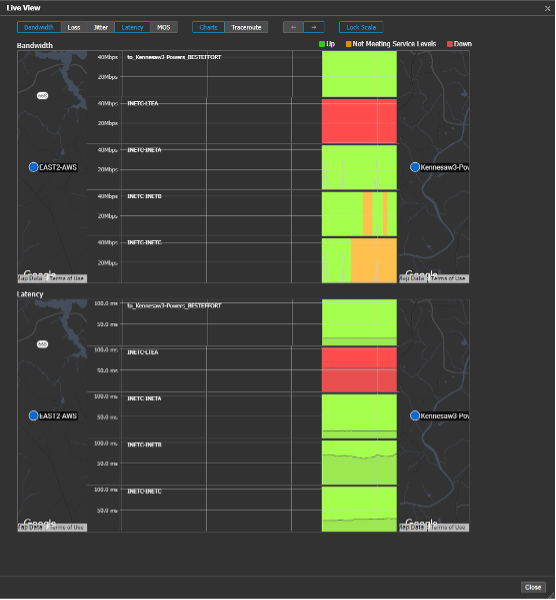
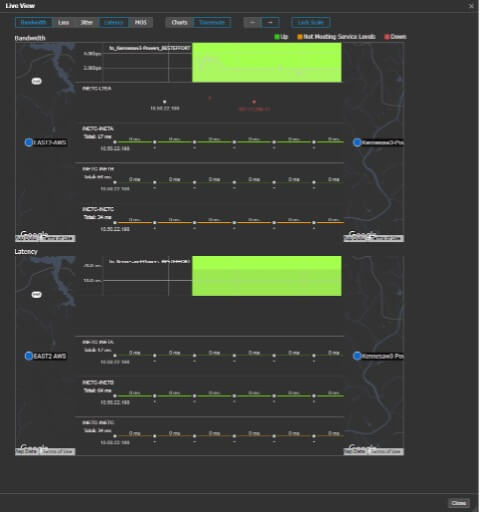
Retrieving stats from EdgeConnect appliances and Orchestrator. Aruba EdgeConnect appliances and Aruba Orchestrator offer rich statistics and performance metrics. Network engineers should regularly retrieve and analyze these stats to monitor network health, link utilization and application performance. Proper monitoring ensures prompt identification of any issues and allows for proactive troubleshooting. For example, the Orchestrator Live View image below demonstrates two charts: one for bandwidth and the other for latency. The bandwidth and latency chart shows five horizontal bar charts. The top chart is the overlay and the four beneath are the underlays for the best-effort business intent overlay. You can select a business intent overlay that has been configured to measure the overlay and underlay for loss, latency, jitter and MOS score. In addition, you can run a traceroute measurement within Live View as it details the route info, router by router, as well as the time it took for each hop.
Using APIs for performance monitoring. Collecting data about network devices and their performance can be much easier with the help of our APIs that support Aruba EdgeConnect SD-WAN. By using our APIs, network engineers can gain valuable insights into interface statistics, CPU usage, memory utilization, and more. If you are interested in learning more about the capabilities of our APIs, head over to the Aruba devHub. In addition, you can also check out the Github project for pyedgeconnect, which is a Python wrapper for Orchestrator and ECOS. There are many examples of how and what can be done with APIs on key performance indicators for measuring performance applications or network monitoring, for example, how to monitor the bandwidth of an EdgeConnect appliance for both WAN0 and WAN1. As a best practice, we recommend using the ECOS APIs endpoint called /stats/minuteStats to get a minute-stats on the interface. The file will provide several files and one of them will be an interface table. The file will provide detailed information for bytes and packets received and transmitted and many other useful measurements.
Understanding overlay tunnels vs. underlay tunnels. It's important to understand the difference between overlay and underlay tunnels for effective SD-WAN management. Overlay tunnels are used for application traffic, while underlay tunnels carry SD-WAN control traffic. Aruba refers to overlay tunnels as Business Intent Overlays (BIOs) and they are crucial for traffic and application matching and forwarding. To ensure optimal application delivery and network stability, it's essential to monitor the performance of both overlay and underlay tunnels.
Here are few questions often help in addressing the application performance issues.
- Does the application have the correct permissions?
- Is the application assigned correctly to the right overlay?
- Is the ACL correct and is it applied to the right overlay?
Steering synthetic polling across specific underlay tunnels or an EdgeConnect site from the internet. Using features such as AppExpress to measure the performance of specific network paths. By steering synthetic polling across selected underlay tunnels, network engineers can accurately assess the quality of those paths and make informed routing decisions.
Polling an EdgeConnect site from the Internet allows organizations to monitor network performance from different locations. This practice helps identify potential regional performance issues and provides a better understanding of application delivery across the SD-WAN fabric.
Security Monitoring Best Practices
Exporting syslog for firewall, audit logs, and alarms. Syslog export is crucial for security monitoring and compliance. By exporting firewall logs, audit trails, and alarms to a central syslog server, network engineers can efficiently analyze security events, detect anomalies, and respond promptly to potential threats.
Understanding traceroute behavior across the SD-WAN fabric. Traceroute behavior across the SD-WAN fabric may differ from traditional networks due to the presence of overlay tunnels. Network engineers should understand this behavior to accurately diagnose connectivity issues and pinpoint the exact location of any network disruptions.
Best practices to optimize the network experience
Aruba EdgeConnect SD-WAN offers robust capabilities for application visibility, real-time performance monitoring and security monitoring. By utilizing features such as NetFlow and IPFIX, REST APIs, and steering traffic across specific underlay tunnels, organizations can improve network visibility, optimize performance and ensure a secure SD-WAN infrastructure. Understanding the behavior of overlay and underlay tunnels and implementing best practices for security monitoring are essential in achieving a resilient and efficient SD-WAN deployment.