
With the integration of diverse technologies, proliferation of ‘other’ devices, and rise of data-intensive applications, network operations have become highly complex, along with the additional burden of security and extensibility.
Let’s consider an example. Many leading universities around the world are powered by HPE Aruba Networking. Post-pandemic, universities are trying to augment the academic experience with a modern, in-campus student experience. An interesting use case is to provide personalized network services that enable students to use and selectively share gaming devices in their dorms. Consider how this drastically alters the access control, security, and performance requirements of the dorm networks, and increases network complexity for an over-burdened network operations team.
IT leaders across industries are attempting to overcome similar challenges and increase the efficiency of network operations by doubling down on tools for simplification, automation, and resilience.
Meet the Next-generation HPE Aruba Networking Central
The next-generation of HPE Aruba Networking Central announced at ATM’23 maximizes the efficiency of Day 0 to Day N network operations with an intuitive, operator-centric experience that is designed to harness the value of data and take advantage of deep AI capabilities.
With next-gen Central, we want to democratize access, interpretation, and understanding of network data across diverse operator profiles and skill levels with the power of human-centered design.
The design foundation makes it easier not only for domain experts but also for L1/L2 engineers to troubleshoot complex issues with diverse datasets, configure and maintain complex networks and so on.
Let’s consider three top recurring customer pain points to elaborate how we do that:
Manual correlations and inefficiencies
Network issues typically originate as innocuous “Wi-Fi is not working” or “my internet is slow” tickets.
First-line support then begins with questions on:
- Was this issue specific to a student or impacted many others?
- Was it a WLAN or LAN or a WAN issue? Was it on their private network or university network?
- Was this a critical business application?
- Was the performance degradation due to a security incident?
These are complex datasets spread across multiple screens – overwhelming the operator, slowing down analysis, and increasing human error. To address this, data must be correlated, interpreted, and presented using a dynamic, multi-dimensional framework – which doesn’t exist today.
The design foundation for next-gen Central solves exactly for this with the multi-dimensional solar-system view. The focus of the investigation (the sun) could be the Site/ Network / Device / Client / Application. All relational elements that can determine the outcome of the investigation are depicted as ‘planets’ around the ‘sun’ (see Figure 1).
These include:
- Networks (WLAN, LAN, WAN, events)
- Clients (users & devices metrics on access, usage, classifications, behavior)
- Applications (institutional & private – metrics on resource consumption, performance scores, user/device relational pivots)
- Security (Authentication & Authorization policy, IDS/IPS, Security & QoS Policy conformance, behavior anomaly, threat scores) and
- Alerts (AI assisted issue diagnosis on connectivity, performance, configuration, and health)
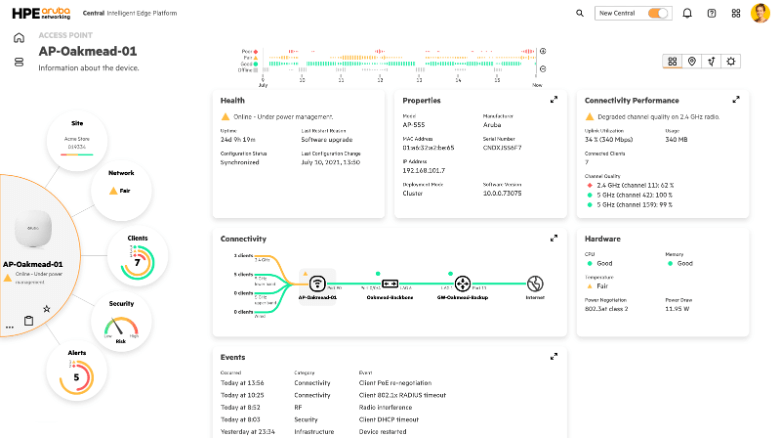
Figure 1: Multi-dimensional solar system view
Each planet also has a composite health score that quantifies the good/fair/poor of the specific attribute, offering a holistic one-glance view at every level of investigation.
This design contextualizes massive amounts of data and offers unparalleled flexibility for operators to analyze the network at varying levels of detail.
One of our partners at Atmosphere’23 rightly said ‘A picture paints a thousand words’.
“...when you can demonstrate an interface like this that’s intuitive, saves time and it makes it easier to do your job, those are all things that resonate with customers and users,” said Joel Grace, senior vice president of IT infrastructure and cloud practice for Sayers, a Vernon Hills, Ill.-based solution provider. The updated interface is less about dashboards and more geared toward the end-user perspective that fits well into “the day in the life of a network administrator,” Grace said.
Rising MTTRs and support costs
Another challenge faced by network operators is the troubleshooting of intermittent issues that occur once and can be exceptionally hard to solve, driving up the mean time to resolution (MTTR).
According to a customer survey we conducted in 2021 – client connectivity, application degradation, service degradation, and Wi-Fi coverage are among the most difficult and revenue-impacting network problems for teams to troubleshoot and resolve, sometimes taking up to >25 hours to resolve and resulting in an average $155K impact to annual revenue.
Typical troubleshooting would involve pouring over voluminous SIEM logs, application logs, network diagnostic commands, triggering a dynamic packet capture, searching through alerts to triangulate a possible event in past and even jumping into the CLI for deeper analysis. Even AI-driven alerts do not capture every intermittent issue if a training pattern hasn’t yet been developed to detect those issues.
It was obvious to us that solutions in the market today do not have adequate toolsets to troubleshoot transient issues on the network.
Next-gen Central introduces a pioneering concept called ‘network time travel’ which allows operators to move ‘back in time’ to troubleshoot. I like to think of it as my favorite 1980s time-traveler The Terminator’s time travel; in this case rather than hunting John Connor, we are trying to figure out where/what/how or when a network issue occurred!
The feature builds a series of snapshots of complex datasets in a time-machine that records events, stats, states, configs, logs, reports, alerts etc. A network operator needs to slide the time-travel, much like hitting a rewind button, to piece together information and root-cause the issue (see Figure 2). We believe this has game-changing potential to define the future of network troubleshooting techniques.
In addition, AI-powered assurance indicators for client experience and device health help operators to proactively manage the network, quickly getting to the proverbial ‘needle in the haystack.’ Not only does Central rapidly analyze the root-cause but also comes up with specific impact (or blast radius) and recommendations for remediations massively reducing time-to-fix by steering the operator through a noisy heap of event triggers and reducing alert fatigue.
Figure 2: Network time travel
Monitoring the operational state of the network
Another common pain point from customers is to visualize the operational state of the entire network in a single view. A network administrator deploys a new site and wants to make sure that the network is working as expected. Imagine the asks of a summarized view of health of physical links, deployment of segments – VLANs/VRFs, operational status of overlay tunnels, congestion, and highlighting any specific issue or attribute for a specific segment of the network.
With the innovative ‘sunburst’ topology, a bird’s eye view of the network visualizing physical and logical connectivity with layers of network performance attributes are interspersed in a single transformational view. This form of interactive visualization is attested to be an ideal design model for the presentation of large, complex, and hierarchical data.
The sunburst view scales for networks of any size and allows engineers to have the most efficient operational graph on which attributes such as segments, link-connections, health, location, presence, heat-maps can be represented as dynamic layers (see Figure 3).
Figure 3: ‘Sunburst’ network topology
Much like on Google Maps, the operator can quickly navigate by searching, zooming, pivoting, and applying multiple layers of visualization to network elements. I believe this is a truly revolutionary technique for network engineers to understand large complex networks, nimbly make changes, evaluate impact, or just look at how the network is playing out.
Stay tuned for more!
This blog barely covers a fraction of what we’re introducing with Central. Look out for more insights and details over the next few months from my colleagues about the innovations that we are building to revolutionize Day 0 to Day N network operations.
More Resources