This two-part series explores into Aruba’s Network Analytics Engine (NAE), a unique framework for network assurance and remediation that’s built into the ArubaOS-CX network operating system. The first blog Using Network Analytics to Spot and Fix Network Issues Faster dives into the NAE architecture and how to speeds network troubleshooting. This blog discusses the implementation examples and use cases more deeply.
Customer expectations in today’s fast-paced digital world have never been higher—and customer loyalty has never been more fleeting. That leaves scant room for IT infrastructure problems that spoil the customer experience. IT teams are under intense pressure to find and fix looming problems before they cause unplanned downtime and to continually improve the user experience.
Network Analytics Engine is an innovation that’s built into ArubaOS-CX running on the Aruba 8400 and 8320 core and aggregation switches. NAE is a unique built-in framework for network assurance and remediation that allows for monitoring, troubleshooting and easy network data collection through the use of simple scripting agents.
Quite simply, NAE lets you analyze a problem in real time. Network operators gain the insight needed to troubleshoot and resolve the issue, or even better, let NAE take corrective action based on established policies.
Let’s take a look at some ways that NAE can help network operators:
Identify Network Anomalies and Security Breaches
Operators generally want to notified if network behavior deviates from the norm. A change in behavior may be due to planned events or unplanned events. In the case of planned events, it is to ensure that the network is flexible to absorb the resulting change. In the case of unplanned events, the operator probably wants to get to the root cause of the anomaly. In situations such as adding IoT devices like security cameras or building management systems, the operator may start monitoring traffic parameters or patterns that cross normal operating modes or threshold boundaries. But first, baselining is required to set these thresholds.
NAE baselines traffic patterns to automatically set network thresholds. It observes user-selected traffic parameters for a predetermined length of time and provides a baseline under normal operating conditions. These parameters could be network-related, such as OSPF neighbor health, or device-related, such as transceiver power levels. Once the thresholds are set, NAE continues to observe these parameters. If a threshold slowly changes over a period of time, NAE considers it to be the new norm and absorbs it into the new threshold. If, on the other hand, spikes are observed in the monitored traffic parameters, an alert is sent to the operator.
Traffic classifiers or ACLs can be used to count very specific types of traffic. A common example is to see if the ratios of DHCP requests and responses are within a certain threshold. NAE observes requests and responses under normal operating conditions and sets a threshold. If there is a sudden unexplained spike in the DHCP request/response ratio, NAE sends an alert to the operator.
Perform Faster Root Cause Analysis
When a VoIP/UC conference call experiences poor voice quality or bad video reception and the network operator receives a complaint from an end user, the operator tries to correlate network events and identify root cause. Event logs from applications and infrastructure are gathered into log analytics tools for root cause analysis.
Poor voice quality or bad video reception may be caused by increased latency due to congestion or packet drops. Often the immediate next step is to gather additional context around the event. This additional information is logged with the original event and sent to the log analytics tool for root cause analysis.
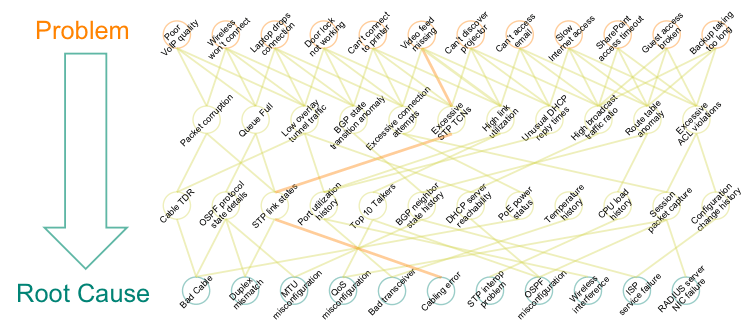
Figure 1: Root Cause Analysis
Instead, NAE agents can be triggered the moment users experience poor voice quality to gather additional switch context surrounding this event in real time. For example, NAE agents can gather events such as “excessive STP TCNs” and contexts such as “STP link states”. Immediately gathering information provides a more accurate representation of the context at the time the event occurred and helps network operators drill down to the root cause more quickly. This is especially useful if the events are intermittent and the operator has to wait an indeterminate amount of time before the event occurs again and the cycle repeats itself.
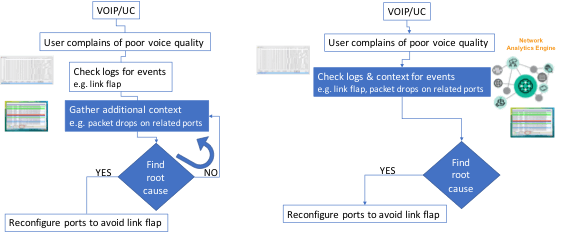
Figure 2: Faster root cause analysis with NAE
More Ways to Use Network Analytics
NAE can be used in a broad range of use cases, including:
- System health - NAE agents can monitor the health of system resources like CPU and memory. These agents monitor and track changes in the switch across time. A CPU alert is archived with detailed information about the system context when the CPU was high, ensuring rapid root cause and resolution to a potentially important alert.
- Network analytics - Having the capability to monitor nearly every statistic in the system and tying in with the time series database for analysis offers a wide range of use cases. Transceiver health and OSPF route health are a couple of examples.
- Security - NAE can inspect traffic and detect anomalous behavior in conjunction with user and entity behavioral analytics (UEBA) security tools such as IntroSpect. Inspecting IoT traffic for spurious behavior is one example of this use case.
- Application visibility - NAE Visibility Lists (using L2/L3/L4 traffic classifiers) enable agents to monitor application traffic as it traverses the core of the network. With NAE Visibility Lists, operators can setup lists to monitor cloud applications like Office365 or Google Suite and track their performance across time in the network. When a degradation is detected, robust network diagnostics can be performed automatically.
- Network optimization - NAE’s deep traffic visibility, analytics capabilities and REST APIs can be used for network optimization. For example, leveraging the knowledge of application performance, operators can adjust the weights of routes to direct application traffic to different links or service providers to ensure a better class of service for the business.
It’s Time for a Better Way to Troubleshoot
Traditionally, context surrounding a network event is gathered by running scripts outside the device, often well after the event has occurred. The delay in gathering of event context makes it less useful for purposes like identifying anomalies, root cause analysis and performance tuning. The turnkey NAE that’s built into AOS-CX running on the 8400 and 8320 switches collects context around network events in real time, giving network operators the freedom and flexibility to respond to network events and anomalies with the new level of speed and accuracy crucial in today’s agile business environment.
Go Deeper
Read the first blog in the series, “Using Network Analytics to Spot and Fix Network Issues Faster."
Read the blog The Three Biggest Network Automation Benefits of REST APIs.
Read the blog ArubaOS-CX: A Modern, Programmable Network for the Mobile and IoT Age, by Tom Black, VP and GM of the campus switching business unit at Aruba.