The importance of networks today cannot be overstated. Think of all the experiences we mostly take for granted in this digital era. Hailing cabs, streaming media, banking online—our lives are more digitized than ever, but such experiences wouldn’t be possible without reliable, always-on network connectivity.
When networks underperform or go down, there is a huge impact on revenue, productivity and customer satisfaction. The reported cost of downtime varies, depending on which report you read, but most put it in the range of $300,000 to $500,000 per hour. That’s some serious cash.
Unfortunately for IT operators, resolving network-impacting problems in a timely manner is more challenging than ever before. That’s because today’s networks are overwhelmingly complex. They’re built on disparate architectures, leverage multiple modes of transport, and connect headquarters, branch offices and mobile users to apps hosted in data centers and the public cloud. The source of a performance issue can be anywhere.
Secondly, network operators are tasked with non-stop updates to support evolving business requirements. But implementing changes manually, device by device, is time-consuming and error-prone, only increasing the risk of issues or outages.
All of this begs the question—if networks are so vital for driving businesses into the future, why must operators rely on yesterday’s tools and processes to manage them?
It’s a concern we often hear from customers and it isn’t one we’ve taken lightly. You may have heard about the exciting innovations we recently introduced to the Aruba CX Switching Portfolio to transform networking for today’s digital world. Well, in this blog, I’d like to highlight the automation and analytics enhancements we’ve made that will transform the experience for operators who manage these critical networks.
Distributed Analytics with the Aruba Network Analytics Engine
When we first launched the Aruba CX Switching Portfolio in June 2017, included was the Aruba Network Analytics Engine (NAE), an on-box application powered by AOS-CX, our cloud-native operating system. NAE interrogates and analyzes any event that could impact network health. Operators benefit from rich analytics embedded in every CX switch, so they have the insights to readily detect and troubleshoot issues.

Now that we’ve extended our CX portfolio to campus access, operators can benefit from distributed analytics across the entire network for even faster problem detection and resolution. How does this compare to other network monitoring and troubleshooting approaches?
Well, network operators used to rely on polling or SNMP traps to try and capture performance problems, but this is often like finding the proverbial needle in the haystack. Streaming telemetry to a central collector is another common approach, but this often results in raw, unfiltered datasets that aren’t readily actionable for troubleshooting, and it also places added strain on the network.
A number of third-party monitoring tools are also available; however, most merely sample data because they can’t provide the scale to collect everything that may be of interest. Without this level of resolution, network operators can’t readily investigate and resolve short-lived or intermittent problems.
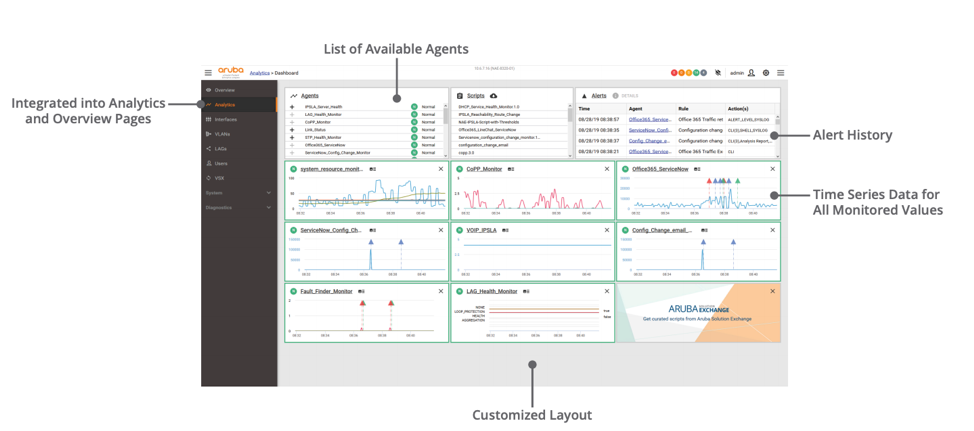
The Aruba Network Analytics Engine overcomes these tradeoffs with intelligent pre-processing of data that turns raw telemetry into actionable insights. This data is presented in an intuitive, web-based UI via time series data graphs and other powerful visualizations, like in the dashboard you see below.

Easy-to-deploy agents establish what data to monitor, specify what conditions constitute irregular behavior, and then automate diagnostic actions when that condition is met. An operator can easily set and modify these parameters as needed within the UI.
The latest release of AOS-CX delivers additional NAE agents for monitoring application, network and device performance. For example, the application health agent can identify whether an application issue is due to an anomaly with the connection setup, the application itself, or the link to the application server. The agent uses two techniques—monitoring the TCP handshake for successful connections or monitoring a customer-configured IP SLA session for things like round-trip time or jitter.
When an anomaly is detected, the NAE agent immediately alerts the operator to the problem and pinpoints where in the network it’s occurring. It can even trigger a ticket in ServiceNow or another incident management tool and pass along the relevant diagnostic details, such as the IP SLA session statistics.
With NAE, there is no more manual polling for issues or sifting through multiple data sources when an event of interest occurs. Instead, NAE proactively detects issues and automatically correlates the associated data to probable root cause—all presented to operators within their existing tools and workflows.
Enhanced Network Automation with Aruba NetEdit
We released NetEdit last year to dramatically simplify life for network operators who are tasked with completing non-stop moves, adds, and changes, often in extremely tight windows. NetEdit automates the rollout of config changes across all relevant devices in the network, while instantly validating that such changes conform to network policy.
Compare this to the tedium of making changes device by device using CLI, or the overhead of rewriting scripts to push out updated configs across multiple devices. Then, manually performing spot checks to ensure those changes are valid and conformant.
NetEdit eliminates this resource drain. And, with the latest release of NetEdit, we’re bringing even more simplicity to the network operator experience.

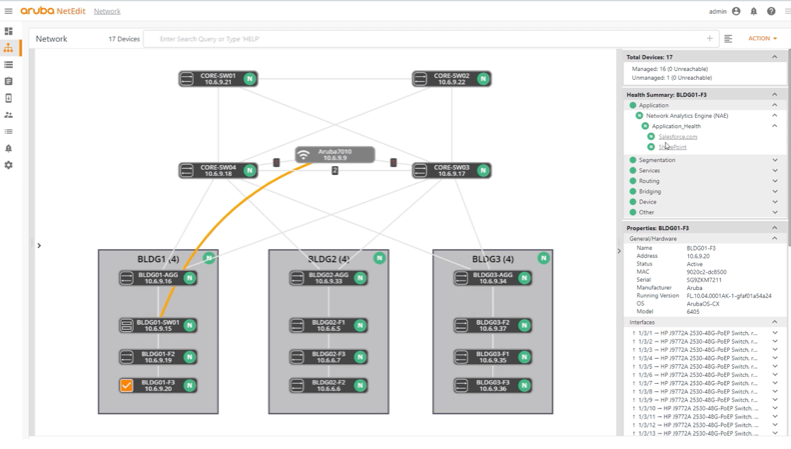
Among the enhancements is a network topology view, as shown above, which provides real-time snapshots into overall network health, with red/yellow/green statuses for every network device. This topology is dynamic in nature, providing tailored views based on what layers of the network an operator selects—devices, applications, network services such as routing and segmentation, and more.
The health information is powered by analytics from NAE, which is now integrated into NetEdit. This further reduces the burden on IT operators when surveying network health and investigating potential or existing problems.

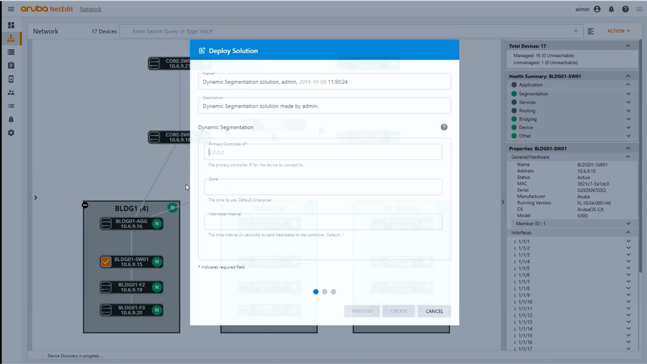
We’ve also introduced enhanced, GUI-driven menus that even further simplify the process of deploying common config changes. As depicted in the screen above, by typing in a couple of parameters and making a couple of clicks. operators can set up dynamic segmentation tunnels between a switch and a policy enforcement firewall to isolate new IoT devices from other parts of the network.
See this capability in action by watching this quick demo.
Deliver a Next-Gen Operator Experience with Aruba CX
Chances are you’re already considering how to make the switch to a next-gen network. Just be sure you enable a next-gen experience for your network operators who will manage it.
Learn more about how the Aruba CX Switching Portfolio delivers the performance and resiliency for today’s digital world, with the built-in programmability, intelligence and automation to swiftly adjust to future business needs.
Further Reading
eBook: Transform the Operator Experience with Enhanced Analytics & Automation
Blog: Use Network Analytics to Spot and Fix Network Issues Faster


