In my last article, we started a conversation about Aruba’s venture into building a better mousetrap... er, network, the CX switching portfolio featuring ArubaOS-CX. If you’ll remember, ArubaOS-CX is built on a model-object design, and the entire network lives virtually in the network state database. Aruba leverages this virtual copy of the network to power up some pretty potent tools. In this second installment of a four-part series, let’s explore one of those tools—Aruba’s Network Analytics Engine.
What in Tarnation is Going on in my Network?
As networks get more complex, network visibility gets highlighted for its role in helping (or hindering, when it is lacking) troubleshooting or predicting issues. There are a number of things that contribute to network complexity.
- BYOD. There will be 10 billion personal smartphones in use by 2020 and that 87% of employers will be dependent on their employees’ ability to access business apps on those smartphones.
- Workplace Mobility. 63% of global enterprises regard mobility as the most significant factor contributing to their competitive advantage, and seven in ten say mobility is a top priority.
- Moving to the Cloud. By 2020, 83% of enterprise workloads will be cloud based.
As networks move with these industry trends to ever increasing complexity, network engineers struggle to see what’s going on in their networks, even as network visibility becomes more and more crucial. The CX switch portfolio answers this problem with the Network Analytics Engine.
Aruba NAE: A Whole Mess of Big Eyes in the Network
Aruba’s Network Analytics Engine is an analytics agent imbedded in each Aruba CX switch. It has its own compute resources to drive it, and when combined in a CX-based network operates to give the everyday engineers eyes into every corner of the network. NAE is always on, conducting real-time sampling once every five seconds. With NAE’s intelligent monitoring, it can keep its eyes on normal operations and alert an engineer to the important stuff, like outages or suspicious behavior.
Some of the things that NAE can be on the lookout for include:
- Network analytics—With eyes in all corners of the network, NAE can pinpoint connectivity issues from Layer 1 to Layer 3, right down to the protocol, device and interface.
- Network optimization—Since NAE maintains a time-series database, it can track traffic trends, and tune routing details like weight or interface cost to make the most of network resources.
- Anomalous traffic—NAE can see into each packet, identify suspicious flows and send them to a firewall or IPS.
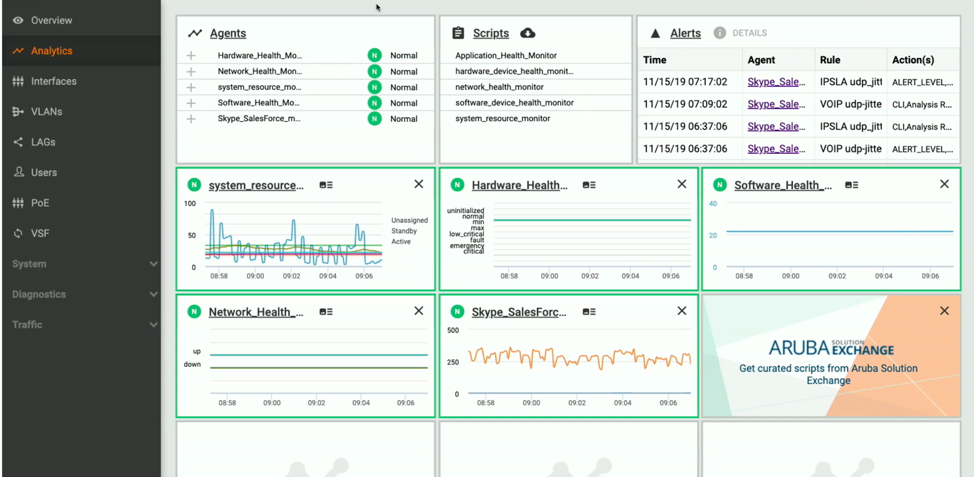
The NAE dashboard is completely customizable so the most important information about the network can be accessed easily. In this example, we’re monitoring application performance.
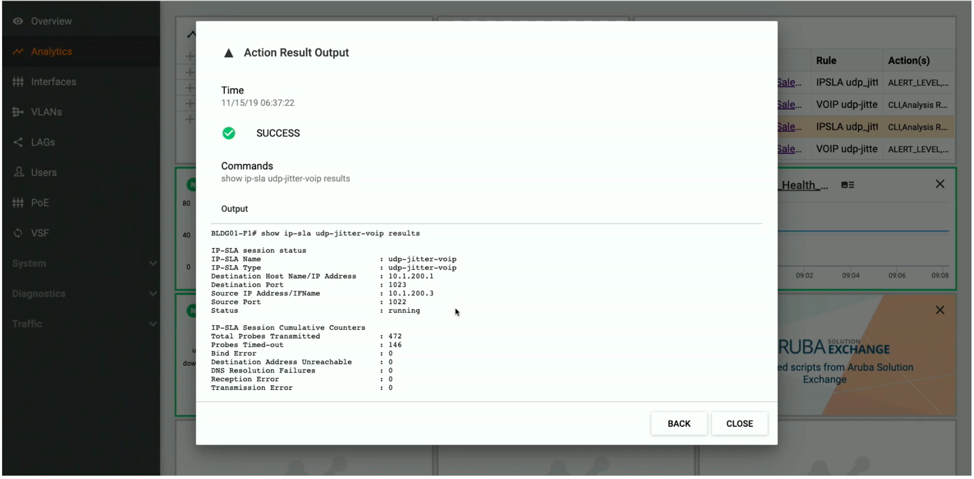
The details of an NAE alert. This one shows that an IP SLA monitoring UDP jitter has detected timed out probes.
Using AOS-CX’s network state database, NAE agents have full access to configuration, protocol states, and all of a device’s statistics. NAE can be configured to monitor configuration-based parameters such as neighbor adjacency or ACL hit count as well as hardware-based metrics, like transceiver, cable, or interface status. By monitoring traffic, NAE can even reach beyond the CX fabric to deduce the health and status directly attached non-CX devices.
But the most exciting thing about NAE is its tight integration with AOS-CX’s other great tool, NetEdit. In the next installment of this series, we’ll take a look at NetEdit, and in the last part of this four-part series, we’ll explore how these two powerful tools work in tandem to make short work of troubleshooting a connectivity failure.
Can you hardly wait? Neither can I! So, keep reading!
Read My Other Blogs
Building a Better Mousetrap: Aruba CX Switches
One-Eyed Cats, Ratholes and the Suffering of Engineers: Aruba NetEdit…Just for Fun!